4月オンライン開催!一橋大学、国連や海外の大学とクライシス・マッピングチャレンジ(マッパソン)に参加
2025年国際人道マップソンは、人道支援マッピングを推進するためのグローバルな二日間のイベントです。イノベーション、コラボレーション、そして地域社会の参加を通じて、危機対応や災害支援に役立つ地理空間ソリューションを生み出すことを目的としています。今年で8年目を迎える本イベントは、世界中のマッパー、開発者、人道支援・危機対応の専門家を結びつけ、国際的な人道支援活動を支える地図作成の力を強化します。
第一部の「クライシスチャレンジ:人々の物語をマッピング」では、初心者から経験豊富なGIS専門家まで、あらゆるレベルの参加者が実際の災害データをもとに、視覚的にわかりやすいストーリーを作成することを求められます。地震、洪水、山火事、紛争、難民危機など、さまざまな災害をテーマに、データを使って情報を提供し、人々を惹きつけ、行動を促す**マップを作成することが課題です。提出された作品は、国連の人道支援専門家を含む審査員団によって評価され、創造性、明確性、そして社会的インパクトの観点から、最も優れたプロジェクトが表彰されます。
第二部の「ヒューマニタリアンマップソン」は4月30日に開催され、地域の拠点とオンラインの参加者が集まり、「Humanitarian OpenStreetMap Task(HOTOSM)」にリアルタイムで取り組みます。本イベントでは、国連のアヴィシャン・ボジャンー氏による基調講演が行われます。彼女は、戦時下のテヘランで育った経験から、テクノロジーが国境を超えて人々をつなぐ力に感銘を受け、IT分野で国連に貢献する道を選びました。彼女は、平和維持データベース、状況認識ツール、そして国連事務総長のデータ戦略など、重要なプロジェクトに関わり、人道支援と平和構築におけるデータとテクノロジーの可能性を示し続けています。
地域と世界をつなぐ本イベントは、協力と学際的アプローチを通じて、人道支援と災害対策を強化する場となります。初心者から経験豊富なGIS専門家まで、すべての参加者にとって、自らのスキルを試し、磨き、データを通じて世界に影響を与える貴重な機会です。活気あふれる国際コミュニティとともに、データストーリーテリングの力で、より良い未来を形作りましょう。
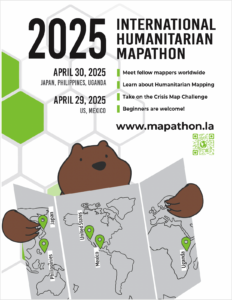
2025 International Humanitarian Mapathon
Participating universities and organizations
- UCLA (U.S.A.)
- Univ.Southern California (USA)
- Kyambogo University (Uganda)
- University of the Philippines (Philippines)
- Reitaku University (Japan)
- Hitotsubashi University (Japan)
- Aoyama Gakuin University (Japan)
Collaborative organizations and partners
- Maptime LA (community partner in the U.S.)
- Metro LA (public transportation in Los Angeles)
- United Nations Depart of Peace Operations (UN Headquarters)
Event Schedule
Part 1: Crisis Map Challenge
- Date: April 22 8:45-10:30 during the class of New Approaches to International Relations
- Location: Classroom 23, West Campus
Your Mission:
Map recent disasters from the past year—whether human-made (conflict, war, refugee crises) or natural (earthquakes, wildfires, floods, etc.). Your goal is to create visually compelling maps or innovative applications that reveal the risks communities face, their resilience in adversity, and their paths to recovery.
What You Can Create:
- Human Story Maps – Elevate the voices of those affected through geo-visual narratives.
- Disaster Preparedness & Response Apps – Develop mobile or web applications that help communities prepare, respond, or recover from disasters.
- Interactive Dashboards – Create real-time visualizations that inform decision-making and aid relief efforts.
- Risk & Impact Maps – Showcase hazard-prone areas, affected and/or vulnerable populations.
- Resilience & Response Maps – Highlight resources and prototype potential emergency response plans.
- Recovery & Reconstruction Maps – Track rebuilding progress, resource distribution, and assessing long-term impacts.
Key Focus Areas:
✅ Mapping Risk – Identify disaster hotspots, vulnerabilities, and threats.
✅ Visualizing Resilience – Show how communities prepare, respond, and adapt.
✅ Tracking Recovery – Highlight rebuilding efforts and ongoing challenges.
✅ Telling Human Stories – Use mapping and technology to shed light on personal experiences and lived realities.
✅ Providing Insights – Offer actionable takeaways for disaster risk reduction and policy change.
✅ Developing Tools – Build apps or interactive platforms that support preparedness, response, or recovery.
How to Submit:
To submit your project, upload your final work to our Padlet submission board at https://padlet.com/UCLA_Library/international-humanitarian-mapathon-2025-8xjwv3mztrshbiqp.
Submission Deadline: Monday, 23:59pm April 27 (we will do a local viewing contest in class next day!)
Ensure your submission includes:
- A title and brief description of your project.
- A link to your map, dashboard, or application.
- Any supporting visuals, screenshots, or documentation.
- Your team name and participant details (if applicable).
Recommended resources and tools for beginners:
– Google My Maps – Easily create and share maps.
– Google Earth Web – 3D representations of disaster locations and stories.
– Kepler.gl – Browser-based tool for visualizing geographic data.
– OpenStreetMap – Access & edit map data from around the world.
– HOTOSM Task Manager – Contribute to real-world humanitarian mapping projects.
– Canva and Google Slides – for creating presentation materials and infographics.
Advanced tools:
– QGIS – Open source GIS for advanced geographic information analysis and mapping.
– Python (Geopandas/Folium) – great for custom analysis and automation.
– Mapbox / MapLibre – for building interactive web maps and dashboards.
– Observable or Deck.gl – for data visualization.
Part 2: Humanitarian Aid Mapathon
- Date: Wednesday, April 30, 2025
- Time: 12:35 p.m.
- Location: 3d floor conference room, 3rd Research Building, East Campus
- Contents:
- Recorded keynote from the UN Department of Peace Operations
- Link up with fellow students based in Asia (and California via online briefly)
- Learn how to use OpenStreetMap
- Contribute to the HOTOSM project
- Digitally map actual buildings to support the project!
- There will also be an award ceremony for the excellent map entries in Part 1!
Best Map Award!
The “Best Map Award” will be given to the best map submitted in Part 1 (Crisis Map Challenge)! Winners will be announced during the Part 2 event. We encourage you to take the challenge!